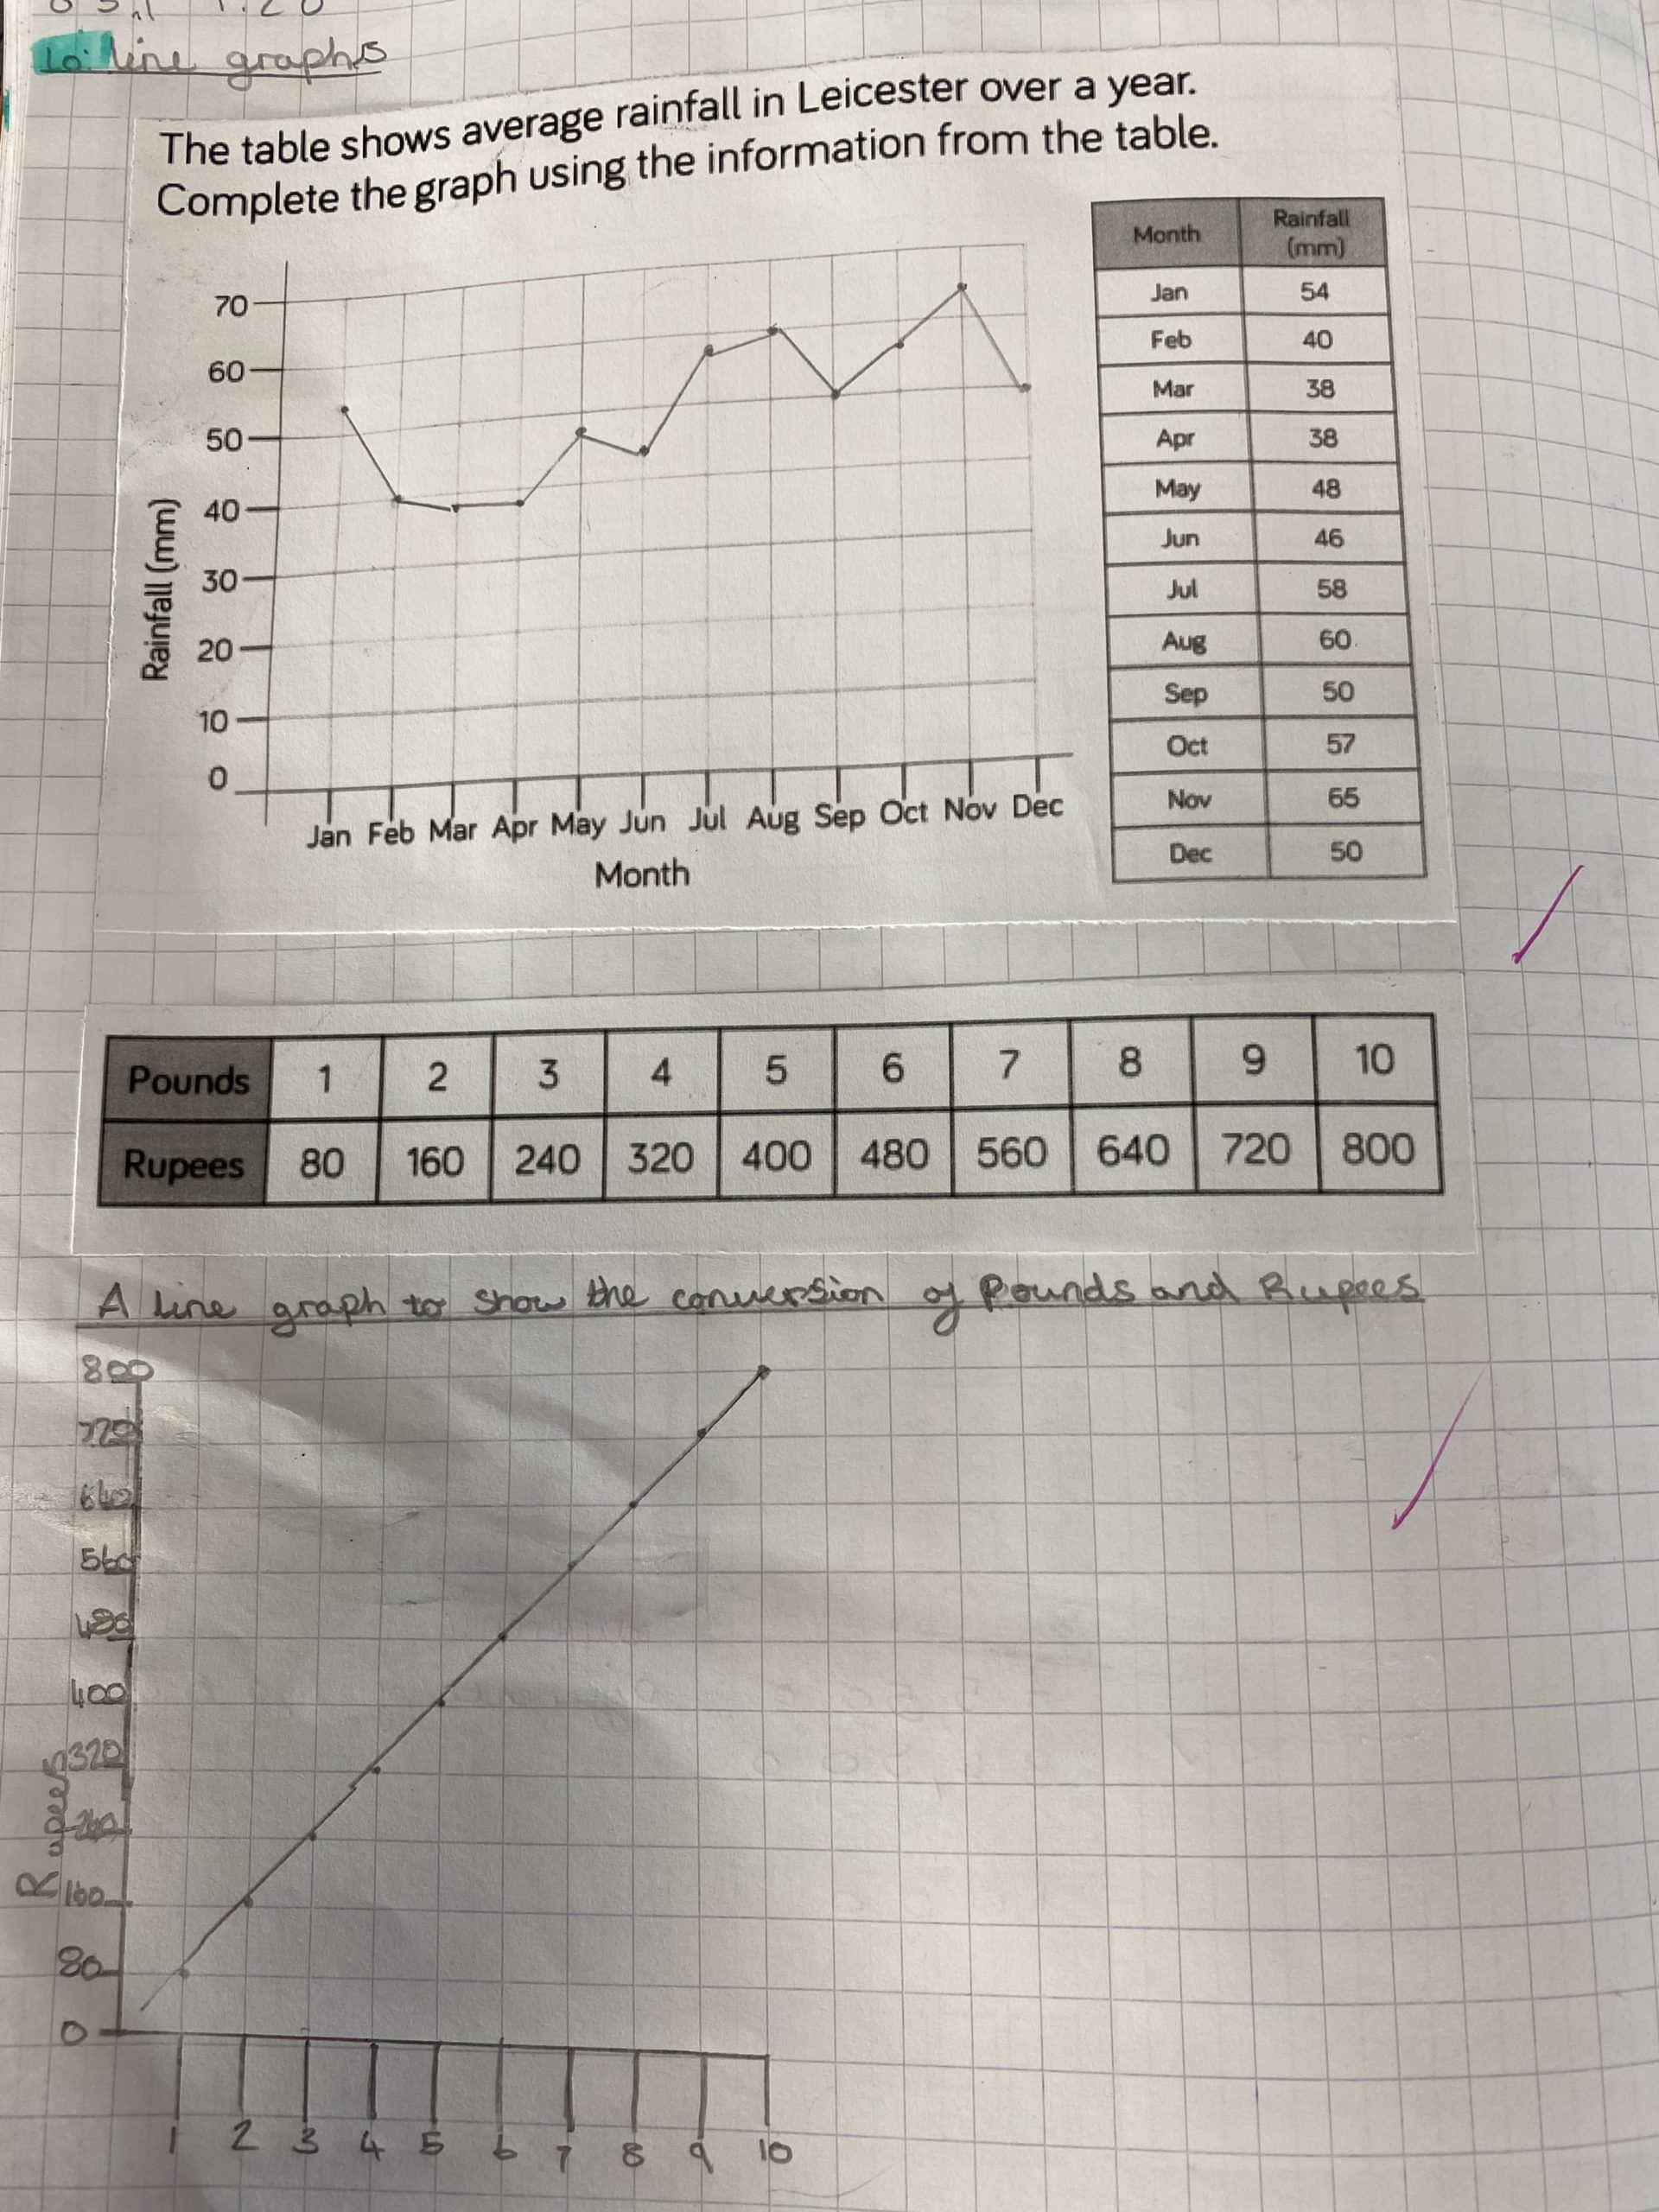
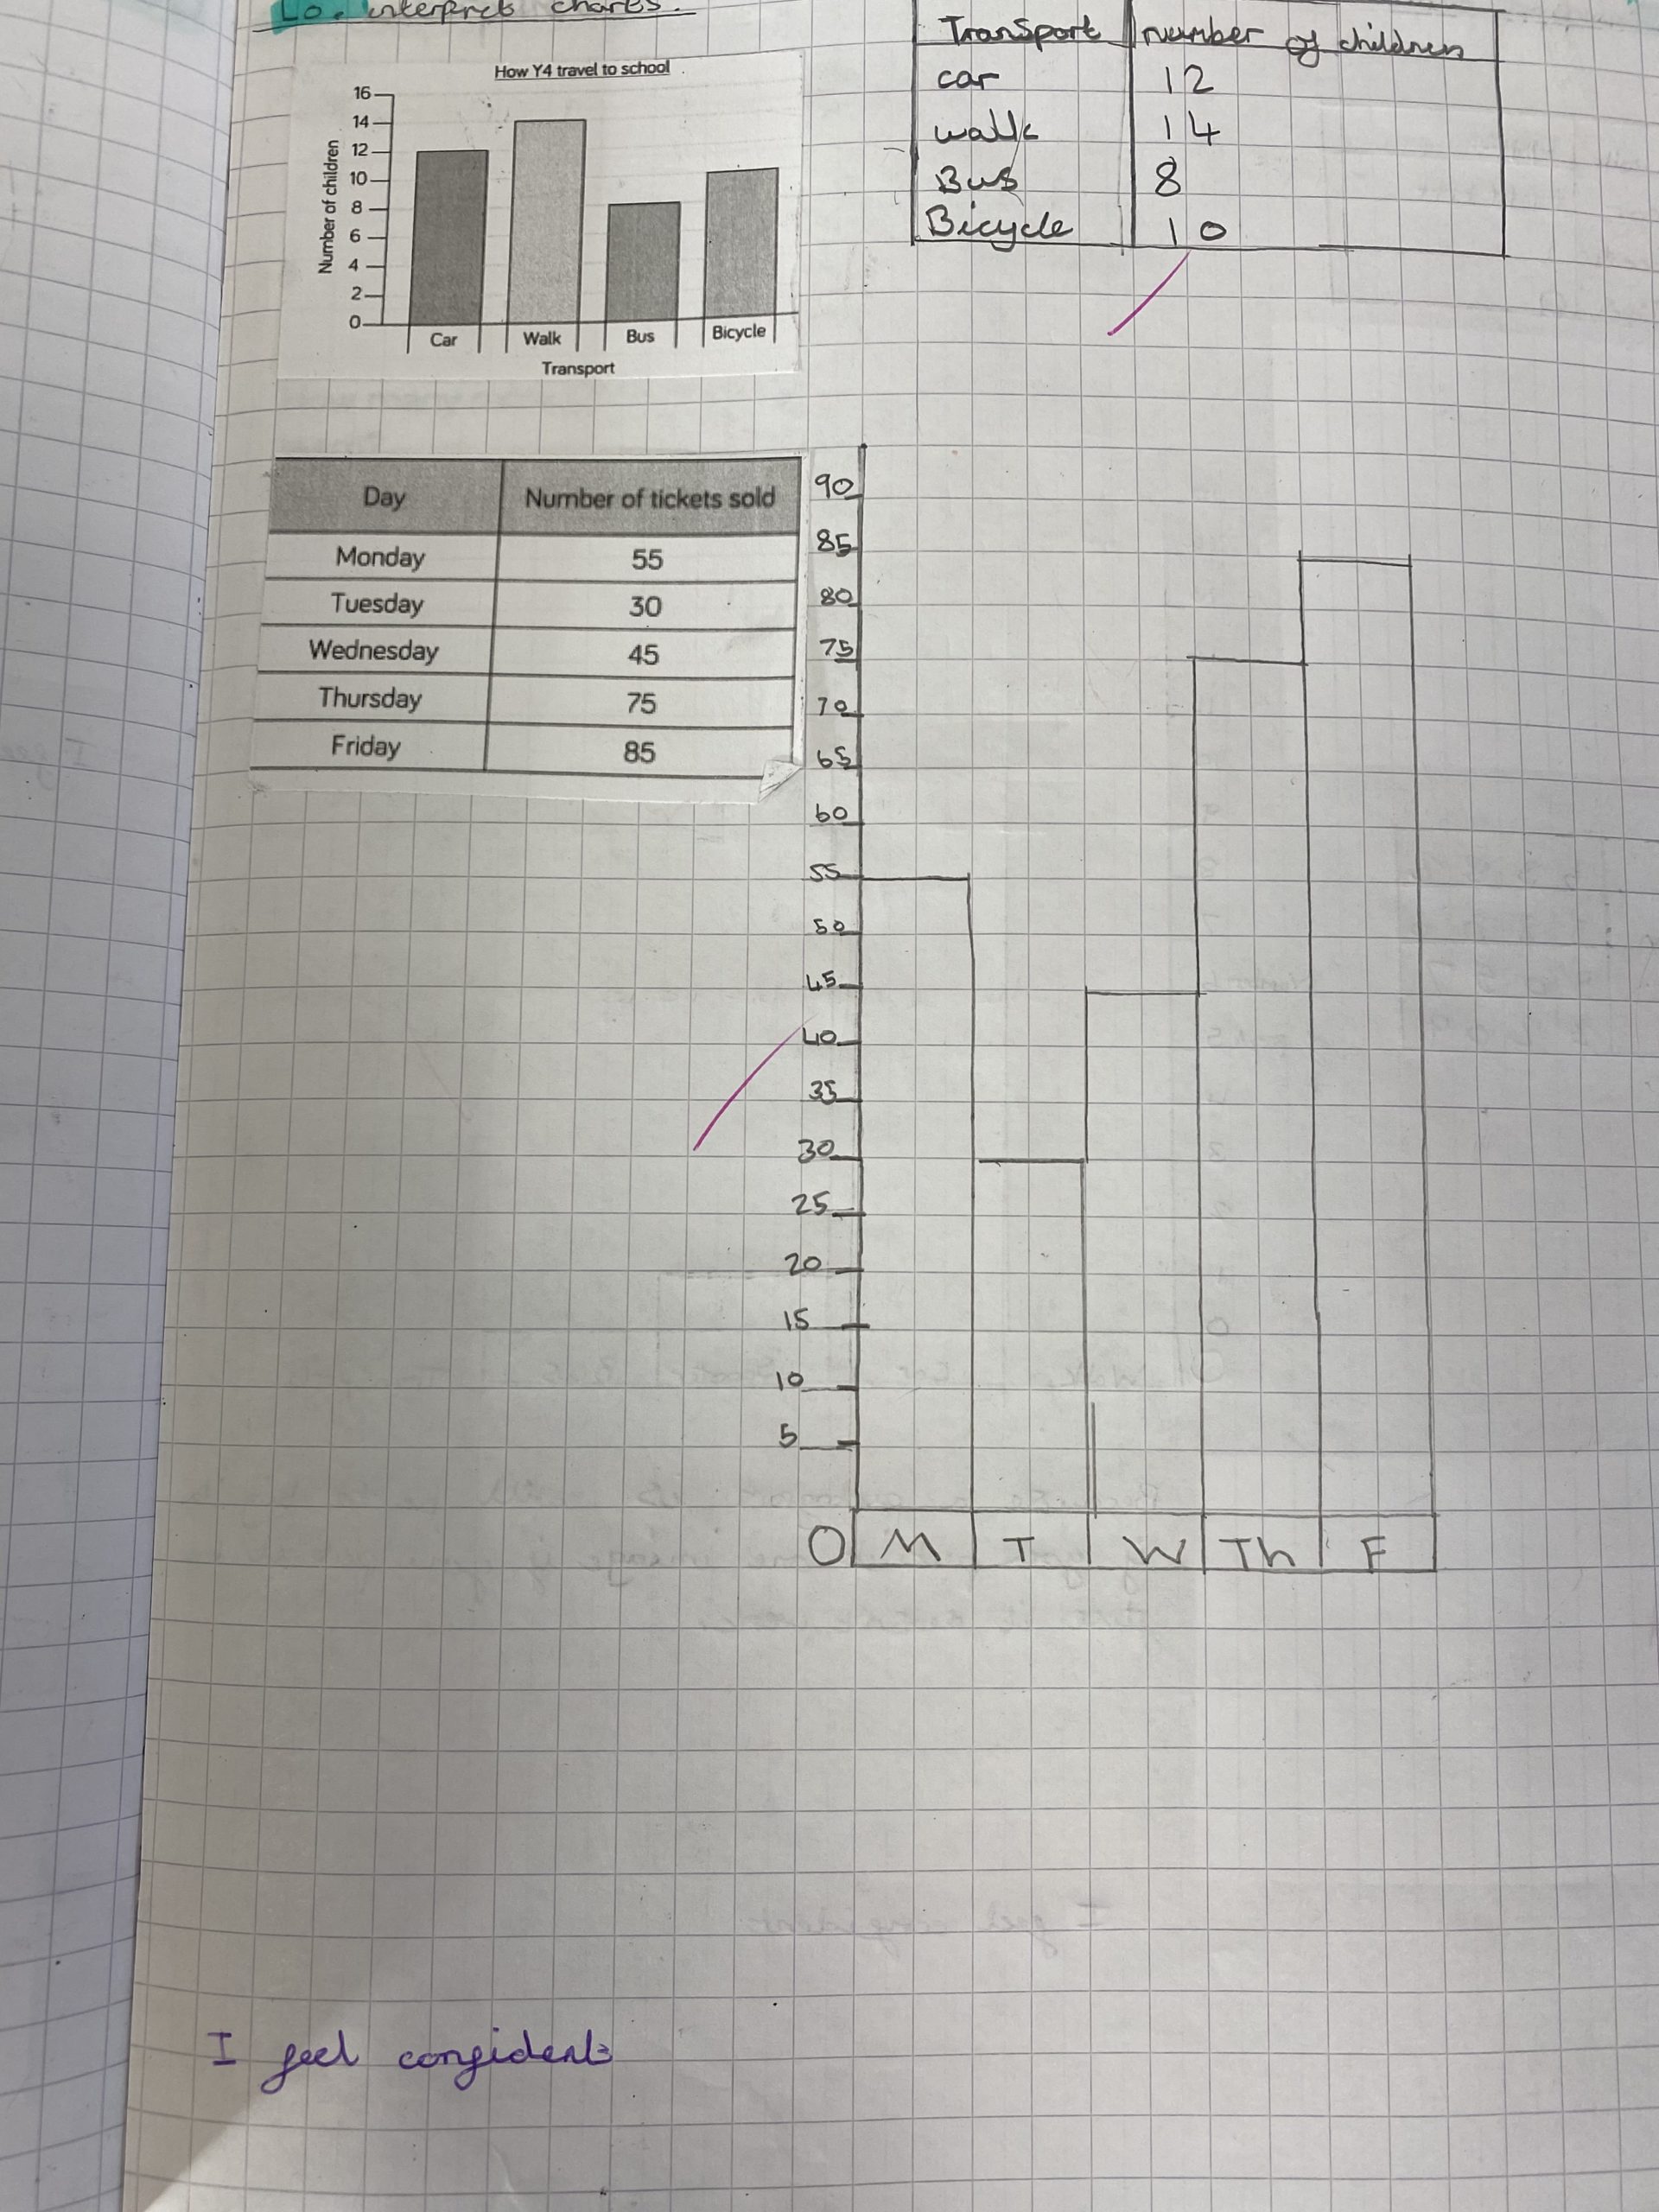
This week, Year 5 have been learning about different types of graph. They have been using tables of information and converting them into bar charts and line graphs. They had to think carefully about their axis and the labels for their graphs. Later this week, they will be collecting their own data about how their heart rate changes during exercise and then they will represent this in graph form.